Comparing Rent vs Buy Calculators: A Five-Year Study
Worked example · Methodology
Two rent-versus-buy calculators can disagree because they answer different questions or use different assumptions. Before choosing between the NYT calculator, Smart Rent or Buy or another tool, match the moving date, property costs, investment assumptions and definition of the result. A difference alone does not establish a math error.
This article replaces our earlier unsupported claims about other calculators with a reproducible example from our own model. We have not verified the current NYT tool's settings in this review, so we do not describe its defaults or label its output incorrect. The study below is not a head-to-head test of competing engines.
Start by comparing the same question
Ask each tool to compare the same home, comparable rent and planned move date. Check whether the result is a monthly payment, cash spent, cumulative net cost or wealth remaining after a sale. Those quantities are not interchangeable.
| Check in each calculator | Why it changes the comparison |
|---|---|
| Moving date and sale assumption | A five-year sale includes different costs and remaining mortgage debt from a longer stay. |
| Upfront and selling costs | Match purchase costs separately from the down payment, and include the planned sale costs. |
| Ownership costs | Use your estimates for property taxes, insurance, maintenance, HOA and additional utilities. |
| Investment and growth assumptions | Match rent growth, home-price growth and the return assumed on money invested instead. |
| Tax treatment and units | Check deduction assumptions, sale-tax treatment and whether dollars are nominal or inflation-adjusted. |
The CFPB's homebuying considerations explain why transaction costs and a possible price decline matter for a shorter stay. They also identify ongoing taxes, insurance, utilities and repairs. Its down-payment guide distinguishes closing costs from the down payment. These sources support the cost categories, not our illustrative percentages.
A five-year study: change two assumptions
We use the same example as the five-year rent-or-buy guide: a $500,000 home, $2,500 starting monthly rent, 20% down, a 6.5% fixed mortgage for 30 years, and a move after five years. Purchase closing costs are 3%; annual property tax 1.2%, insurance 0.5% and maintenance 1% of modeled home value; HOA is $0. Rent grows 3% annually and the hypothetical investment return is 6%.
We vary only annual home-price growth (0%, 2%, 4%) and sale costs (3%, 6%, 9% of modeled sale price). These are deliberately chosen scenarios, not current market estimates, forecasts, probabilities or confidence intervals. They do not describe any city. Flat prices are not a worst case; prices can fall, and repairs or other costs can be higher.
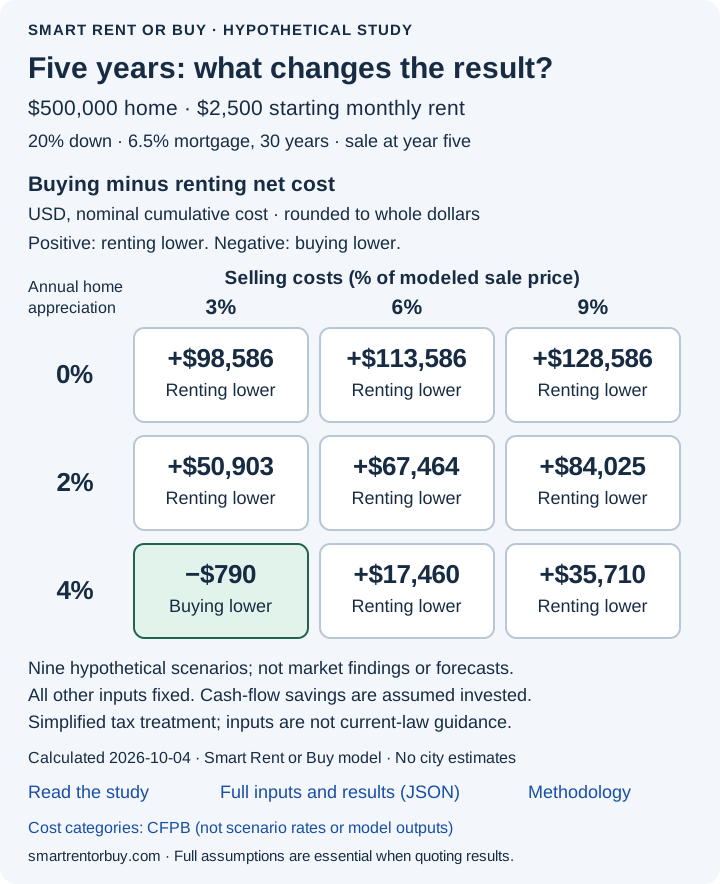
Download the chart with assumptions and source links (SVG). On a narrow screen, scroll the chart horizontally; the same results are available in the text table below. This is a fixed public example, not your personal calculator inputs.
The table shows nominal cumulative modeled net cost at year five, rounded to whole US dollars. Lower net cost is better within this model. A positive buying-minus-renting difference favors renting; a negative difference favors buying.
| Home growth per year | Sale costs | Buying net cost | Renting net cost | Buying minus renting |
|---|---|---|---|---|
| 0% | 3% | $213,349 | $114,763 | $98,586 |
| 0% | 6% | $228,349 | $114,763 | $113,586 |
| 0% | 9% | $243,349 | $114,763 | $128,586 |
| 2% | 3% | $165,355 | $114,453 | $50,903 |
| 2% | 6% | $181,917 | $114,453 | $67,464 |
| 2% | 9% | $198,478 | $114,453 | $84,025 |
| 4% | 3% | $113,344 | $114,133 | -$790 |
| 4% | 6% | $131,593 | $114,133 | $17,460 |
| 4% | 9% | $149,843 | $114,133 | $35,710 |
Run the numbers for your specific situation — no sign-up required.
Download the nine scenarios and full input assumptions (JSON). This is a fixed public example containing no personal calculator inputs. It retains unrounded results so you can reproduce the displayed amounts.
At 4% home growth and 6% sale costs, buying net cost is $131,593, renting net cost is $114,133, and renting has the lower modeled cost by $17,460. Lower sale costs to 3% at the same growth rate and buying instead has a small modeled advantage of $790. That reversal shows why matching assumptions matters; it does not establish that either set of sale costs is available to you.
Across these nine chosen scenarios, buying net cost ranges from $113,344 to $243,349. This range describes the inputs we tested; it is not a likely-outcome range.
Why does the renting result also change?
Home growth changes modeled owner costs tied to the home's value. Our model invests the cash-flow difference on the cheaper housing side each year, so changing owner costs can also change the renter's investment contributions and ending assets. Selling costs affect the modeled sale. Read both costs for each scenario instead of assuming one side stays fixed.
Reproduce a row in the explorer
- Open the break-even explorer. Set price $500,000, monthly rent $2,500, down payment 20%, mortgage rate 6.5%, and planned stay 5 years.
- Set home growth to the row you want. Open Adjust ownership costs and growth assumptions and set purchase costs 3%, sale costs to the row's value, tax 1.2%, insurance 0.5%, maintenance 1%, HOA $0, rent growth 3% and investment return 6%.
- Apply the scenario. Read the five-year comparison and annual row, then choose Download annual comparison to export the applied inputs and results. Reapply after changing an input.
- Compare other moving dates only after reproducing the five-year row. A crossing at another year does not answer the five-year question.
The study also fixes extra owner utilities at $100/month, renter insurance $20/month, a refundable one-month rent deposit and moving costs $2,000 per side. Broker fee, parking, furniture and upfront repairs are zero. The full input snapshot is in the JSON; the five-year guide explains the assumptions and 3/5/7-year comparison.
What the study can and cannot tell you
Net cost is money paid in, including invested savings, minus ending assets. The buying side includes modeled sale proceeds after selling costs, loan payoff and sale tax, plus investments. The rental side includes investments and the returned deposit. The renter starts with the unused upfront capital; the model assumes the cheaper annual housing option invests the cash-flow difference. A lower modeled cost does not establish that you can fund the down payment or qualify for a mortgage.
Tax settings are illustrative, not current tax law: single filing status, 22% marginal tax rate, $14,600 standard deduction, no other itemized deductions and 15% capital-gains rate. The unchanged model has simplified deduction caps and home-sale exclusions. No claim of full 2026 tax accuracy or eligibility is made. See the methodology before applying results to your circumstances.
These scenarios isolate two assumptions; they do not cover all uncertainty. Returns are hypothetical, the cash-flow investment behavior may not match yours, and flexibility, housing stability and the work of ownership have no assigned dollar value. Use actual written estimates for comparable properties, then test less favorable inputs. No calculator result is a guarantee.
Sources and reproducibility
Calculated October 4, 2026 with Smart Rent or Buy's existing engine and the explicit input snapshot in the download. Dollar outputs are rounded only for display; subtraction of displayed values may differ by $1. CFPB sources above were checked October 4, 2026. The study outputs are our calculations, not figures published by CFPB or NYT.